
Post Content
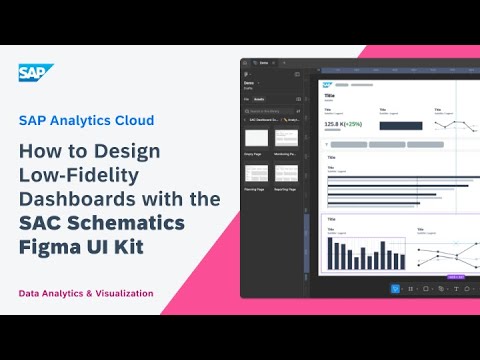 [[{“value”:”In this video, you will learn how to use the SAP Analytics Cloud Dashboard Schematics UI Kit to quickly sketch out dashboards in Figma. Discover how to use pre-built analytical page types, add charts and UI components, and create your own layouts to speed up the early stages of dashboard design.
Chapters:
0:00 Intro
0:18 Overview of the kit
0:47 Start with an analytical page type
1:17 Build a layout from scratch
Recommended Help Topics:
•Download the Library:
https://github.com/SAP-samples/analytics-cloud-datasphere-community-content/tree/main/Technical_Samples/SAC_Fiori_Horizon_Theme
•Dashboard Design Best Practices
https://community.sap.com/t5/technology-blog-posts-by-sap/dashboard-design-best-practices/ba-p/14030655″}]] Read More SAP Help and Learning
#SAPCHANNEL